Data & Concept Visualization
Leveraging state-of-the-art visualization tools to provide easy understandable information to policy and decision-makers
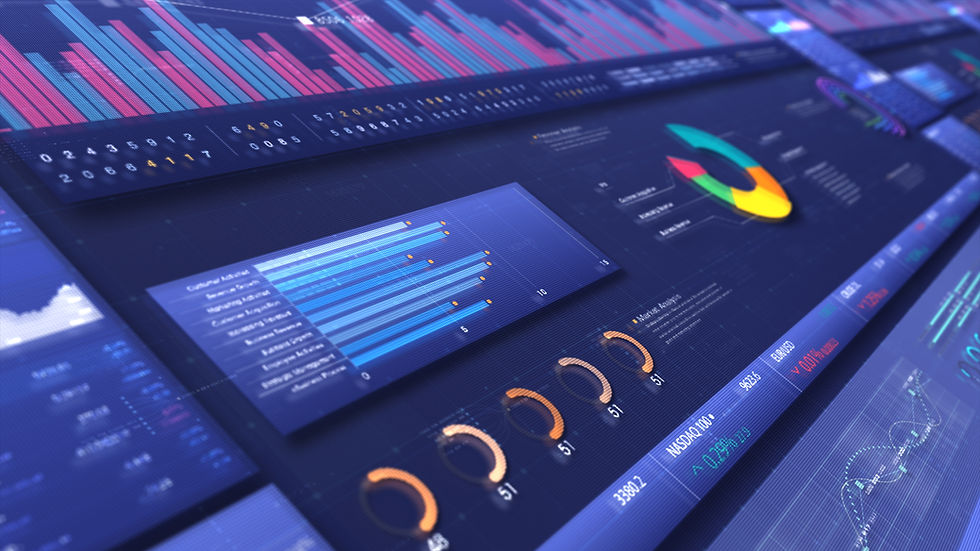
At Sixth Degree, we are at the forefront of utilizing innovative data visualization tools to enhance the capabilities of companies and governments. In the era of big data, policymakers and strategic decision-makers increasingly rely on our advanced data and concept visualization technologies to transform complex information into clear, actionable insights. By converting raw data into intuitive visual formats, we make it easier to identify patterns, trends, and insights.
Data visualization is the graphical representation of information and data, transforming raw data into visual elements such as charts, graphs, and maps. These tools offer an accessible means to comprehend complex data sets by highlighting trends, outliers, and patterns, enabling more informed decision-making and clearer communication.
Concept visualization, on the other hand, involves mapping out ideas and relationships to make complex concepts more understandable and communicable. This approach often employs diagrams, mind maps, and flowcharts to illustrate how different components interconnect, facilitating easier grasp and sharing of intricate ideas.
Both data and concept visualization are crucial in various fields. In business, data visualization can reveal market trends and financial performance, aiding strategic planning. In education, concept visualization helps students understand complex theories and relationships. In science and technology, both methods are used to illustrate research findings and technical processes, enhancing comprehension and innovation and in government, it allows policy makers to make sense of millions of available data points and take informed decisions.
How we help clients
A vast experience in different organizational and cultural settings
Data and concept visualization serve as the cornerstone for sustained success in both business and public sector endeavors. By prioritizing the innovative application of visualization techniques, organizations can interpret complex data, streamline decision-making processes, and convey strategic insights with unmatched clarity and impact. This empowers them to navigate challenges and seize opportunities in an ever-evolving landscape with confidence and agility.
